Categories: GSI Online Library, Teaching Effectiveness Award Essays
by Thunwa Theerakarn, Mathematics
Teaching Effectiveness Award Essay, 2014
Multivariable Calculus (Math 53) deals with mathematical objects in three- (or more) dimensional spaces. For example, the graph of a two-dimensional function is a surface in three-dimensional space. For many concepts in this subject, having geometric intuition is very helpful for a better understanding. However, many students struggle to visualize these concepts because they cannot actually “see” them. A major problem is that it is difficult to clearly explain phenomena occurring in three or more dimensions on a two-dimensional chalkboard. It is even more difficult for students to explore these concepts on their own.
To help students develop geometric thinking, I used Mathematica to create interactive applets that can display multiple three-dimensional graphics at the same time and can overlay extra information on those graphics. Students can interact with the graphics and investigate the same phenomena on various examples. For each topic, I illustrated the concepts using my applets in class. Students could access the applets later on their personal computers from the course website.
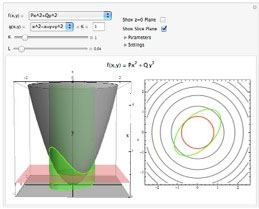
Figure 1: Screenshot of one of Thundra Theerakarn’s interactive applets
For example, Figure 1 is an applet about Lagrange’s multiplier method, which is used to find the maximum and minimum of a function over a constraint. This applet illustrates the geometric idea behind the method. In this example, we find the maximum and minimum of function f(x,y) = x2 + y2 on the constraint g(x,y) = x2 – xy + y2 = 1 (the green ellipse on the xy-plane). The green curve on the left shows the values of the function on the constraint. The highest points on the green curve give the maximum and the lowest points give the minimum. As the red plane moves from below, the first time it hits the green curve gives the minimum. The right panel shows the contour map of f. Each gray curve represents points that give the same height on the graph. As a user moves the red plane from below, she can see the red circle getting larger and larger. The moment that the red plane hits the green curve in the left panel is the same moment the red curve curve touches the green curve in the right panel. With this, students can “see” what is happening in the theorem. To see this example, go to http://bit.ly/Lmult.
I regularly received suggestions from students how to improve these applets. In the mid-semester teaching evaluation, I asked whether they found the applets useful and whether they had used the applets outside the classroom. Most students reported that the applets gave them a better understanding of geometric concepts in calculus. About half of the students regularly used the applets to study and do homework. At the end of the semester, some students commented that they found the applets to be very helpful.