by Nicholas Kern, Astronomy
Teaching Effectiveness Award Essay, 2017
In the Astronomy Department, we place a strong emphasis on teaching our students how to problem solve. This means we tend to prioritize fluency with equations and their physical contexts over route memorization of numbers and concepts. One way I accomplish this is through section worksheets, where I break my class into small-groups to work on a set of problems while I provide Socratic supervision. This gives me an opportunity to inspect and teach problem solving skills in real-time. However, over the course of a long and stressful semester, section worksheets quickly lose their luster and become somewhat of a chore for students who come to Astronomy in the first place to study exciting phenomena like the bending of space-time by black holes and the explosion of high-mass stars. Lack of engagement means I spend precious time getting students to focus, and often need to explain worksheet instructions multiple times.
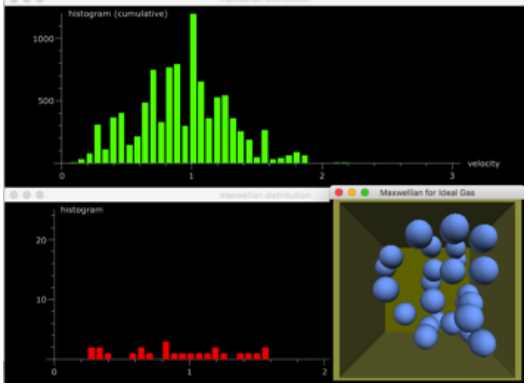
In order to get students to engage more with section worksheets, I began writing software to make visualizations of class material. I’d then preface section worksheets by showing my students these visualizations and even allowed them to alter some of the parameters by-hand to see the effect it had on the outcome of the visual. I found that this primed their creative, problem-solving intellects, and saw students become more engaged in section with the problems I then provided in the worksheets. This also allowed me to show my students different ways of seeing and approaching a problem, paired the concepts from class with a visual medium, and enabled them to phrase their questions on the worksheet material within the context of the visualization. Figure 1, for example, shows a 3D movie I created of an ideal gas (blue spheres in a box), where I demonstrate that their collective velocity distribution converges to the Maxwell-Boltzmann distribution over time, which is also the velocity distribution of hydrogen ions in our Sun!
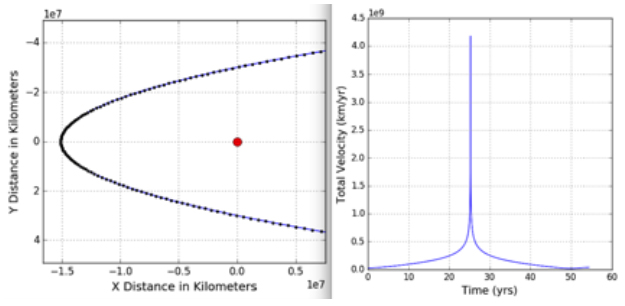
These efforts also allowed me to create entire interactive worksheets focused on getting the students to directly engage with the computer simulation. One week, for example, I was teaching Kepler’s Laws, which describe the orbital properties of a two-body system, like the Sun and Earth. I wanted to convey that Kepler’s Laws were originally empirical laws: laws that were devised simply to match Kepler’s observations. To do this, I wrote a computer simulation that solves for the gravitational interaction between the Sun and a comet, and had it output images of the comet’s orbit and velocity profile. The task for my students during section was to run the simulation and use the output images as their observations to derive Kepler’s Laws for themselves. Figure 2 shows example simulation output of a comet orbiting the Sun, from which they were able to derive Kepler’s Laws. This was a fun problem-solving experience for my students, where they got a chance to practice class material with a visual and hands-on approach. The takeaway was that I didn’t input Kepler’s Laws into my simulation; all I did was write a code that solves the gravitational equation. In applying it to a two-body system like the Sun and a comet, Kepler’s Laws naturally emerge, which they could now visually confirm for themselves.
My efforts to boost class engagement with visualizations of class material received positive student feedback. Students regularly commented that having a visual and interactive medium for revisiting class material helped comprehension; I found that my section attendance stayed high throughout the entire semester, and I received end-of-the-year student feedback such as “nice, prepared worksheets,” and “worksheets were helpful,” and “cool Python demos.”